KMeans Clustering
Contents
KMeans Clustering#
this notebook made with help from Sam Fielding
A proof of concept of applying clustering analysis to the data…
Environment setup#
import os
import datetime as dt
import pandas as pd
import numpy as np
import xarray as xr
import dask as da
from dask.diagnostics import ProgressBar
import zarr
# import holoviews as hv
# import hvplot.xarray
import matplotlib.pyplot as plt
from tqdm.auto import tqdm
from sklearn.cluster import KMeans

from src.env import ICOS_FILE

TMPDIR = os.getcwd()
zarr_store = os.path.join(TMPDIR, "datacube_test.zarr")
print("Using:", zarr_store)

xr.set_options(
    display_expand_attrs=False,
    display_expand_data_vars=True
);
Using: /home/ash/code/geomagnetic_datacubes_dev/notebooks/datacube_test.zarr
Initialise data to use#
# TODO: Store this information in the datacube directly
# Load the coordinates, stored as "40962" within the HDF file.
gridcoords = pd.read_hdf(ICOS_FILE, key="40962")
# gridcoords["Latitude"] = 90 - gridcoords["theta"]
# gridcoords["Longitude"] = np.vectorize(lambda x: x if x <= 180 else x - 360)(gridcoords["phi"])
gridcoords["QDLat"] = 90 - gridcoords["theta"]
gridcoords["MLT"] = gridcoords["phi"]/15
gridcoords = gridcoords.to_xarray()
gridcoords = gridcoords.drop_vars(["theta", "phi"])
gridcoords
<xarray.Dataset>
Dimensions:  (index: 40962)
Coordinates:
  * index    (index) int64 0 1 2 3 4 5 6 ... 40956 40957 40958 40959 40960 40961
Data variables:
    QDLat    (index) float64 -2.911 -4.072 -2.909 -4.439 ... 31.72 -31.72 31.72
MLT (index) float64 8.382 8.489 8.489 8.416 8.362 ... 0.0 0.0 12.0 12.0ds = xr.open_dataset(
zarr_store, engine="zarr", chunks="auto"
)
# Just pick one year
_ds = ds.sel(Timestamp="2015")
# .. at 1 minute sampling
_ds = _ds.isel(Timestamp=slice(0, -1, 6))
# # # Just pick the northern polar region
# ds.where(ds["QDLat"] > 50, drop=True)
# Isolate to the data we want to work with
_ds = _ds[["B_NEC_res_CHAOS-full", "gridpoint_qdmlt"]]
_ds.load()
_ds
<xarray.Dataset>
Dimensions:               (Timestamp: 516965, NEC: 3)
Coordinates:
  * NEC                   (NEC) object 'N' 'E' 'C'
  * Timestamp             (Timestamp) datetime64[ns] 2015-01-01 ... 2015-12-3...
Data variables:
    B_NEC_res_CHAOS-full  (Timestamp, NEC) float64 3.539 -6.78 ... -227.5 -32.86
    gridpoint_qdmlt       (Timestamp) int64 37454 27138 19611 ... 29219 29215
Attributes: (2)Extract data to input to KMeans#
This next step seems unnecessarily slow. Should find a more sensible way to do it 🤔
def extract_n_values_gridwise(ds=_ds, n=20):
    # Initialise array to populate with B_NEC vectors
    arr = np.full((40962, n*3), np.nan)
    # Set fixed seed for predictability
    np.random.seed(123)
    # Loop through each gridpoint
    for grid_index in tqdm(range(40962)):
        # Identify data within this gridpoint
        B_NEC = ds["B_NEC_res_CHAOS-full"].where(ds["gridpoint_qdmlt"] == grid_index, drop=True).data
        # Pick n random entries from given gridpoint
        try:
            random_choice = np.random.choice(len(B_NEC), size=n, replace=False)
        except ValueError:
            # There will be nans in the output where there are < n samples available
            continue
        arr[grid_index, :] = B_NEC[random_choice].flatten()
    return arr

arr = extract_n_values_gridwise(_ds, n=10)
cluster_data = gridcoords.assign(input_data=(("index", "dim_1"), arr))
cluster_data = cluster_data.dropna("index")
cluster_data
<xarray.Dataset>
Dimensions:     (index: 22596, dim_1: 30)
Coordinates:
  * index       (index) int64 1 4 8 9 13 14 ... 40956 40957 40958 40960 40961
Dimensions without coordinates: dim_1
Data variables:
    QDLat       (index) float64 -4.072 -3.857 -2.109 ... -31.72 -31.72 31.72
    MLT         (index) float64 8.489 8.362 8.201 8.275 ... 6.0 0.0 12.0 12.0
input_data (index, dim_1) float64 -8.061 15.44 5.785 ... -34.52 -18.53Apply KMeans algorithm#
def variance_for_n_clusters(arr, nmax=15):
    """Perform clustering analysis for n=1,2,3... clusters

    Returns a figure showing the variance as a function of
    number of clusters
    """
    # Collect variance for each fit
    cluster_number = []
    variance = []
    # Calculate for number of clusters, numbers from 1 to 15
    for k in tqdm(range(1, nmax)):
        kmeans = KMeans(init="random", n_clusters=k, n_init=30).fit(arr)
        variance.append(kmeans.inertia_)
        cluster_number.append(k)
    # Plot Cluster number against variance
    fig, ax = plt.subplots()
    ax.plot(cluster_number, variance)
    ax.set_xlabel("Cluster Number")
    ax.set_ylabel("Variance")
    ax.set_title("Variance by increasing cluster number")
    plt.close()
    return fig

variance_for_n_clusters(cluster_data["input_data"])
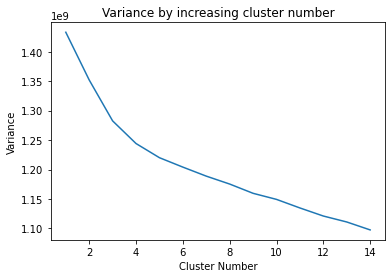
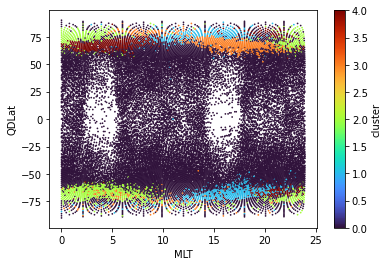
Let’s pick 5 clusters…
kmeans = KMeans(init="random", n_clusters=5, n_init=30).fit(cluster_data["input_data"])
clusters = kmeans.predict(cluster_data["input_data"])
cluster_data = cluster_data.assign(cluster=(("index", clusters)))
cluster_data
<xarray.Dataset>
Dimensions:     (index: 22596, dim_1: 30)
Coordinates:
  * index       (index) int64 1 4 8 9 13 14 ... 40956 40957 40958 40960 40961
Dimensions without coordinates: dim_1
Data variables:
    QDLat       (index) float64 -4.072 -3.857 -2.109 ... -31.72 -31.72 31.72
    MLT         (index) float64 8.489 8.362 8.201 8.275 ... 6.0 0.0 12.0 12.0
    input_data  (index, dim_1) float64 -8.061 15.44 5.785 ... -34.52 -18.53
cluster (index) int32 0 0 0 0 0 0 0 0 0 0 0 0 ... 0 0 0 0 0 2 1 0 0 0 0cluster_data.plot.scatter(x="MLT", y="QDLat", hue="cluster", s=0.5, cmap=plt.get_cmap("turbo"));